JTAG for Rpi3
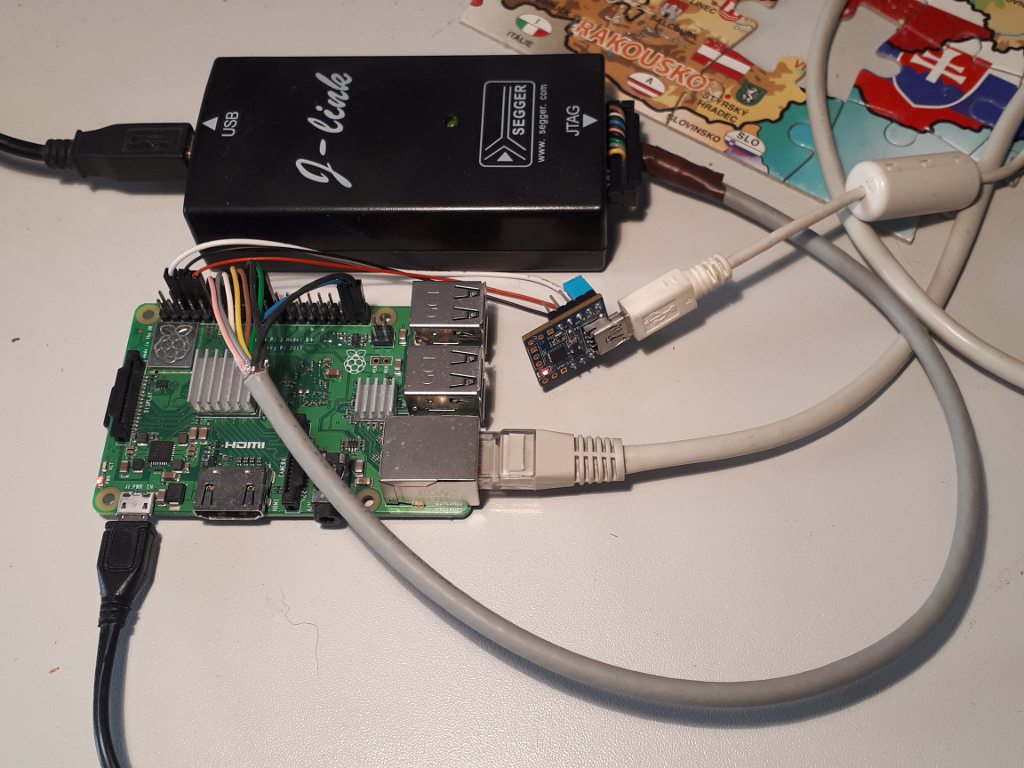
Picture above: A JTAG debugger (blackbox), among other things, connected to an Rpi3 board.
JTAG is a special hardware connection to a target board, allowing debugging of the target board in situ -- watching registers, setting breakpoints, dumping memory regions -- just as we debug kernel on QEMU.
While sounding very useful, JTAG is not widely used even by kernel hackers as a debugging method. When building kernels on real hardware, programmers mostly debug by printing to UART, except for the very early stage of kernel boot, before the UART is up.
Because of this reason, hardware/software for JTAG is lacking, even for popular boards like Rpi. Years ago, I have done JTAG debugging with a board of Texas Instruments (Pandaborad, Cortex-A9) with their $5,000 proprietary tool. I can attest it was very difficult to use.
For education purpose though, it may be useful to watch registers & set breakpoints when we play with Rpi3. There are reports on how to do so (see references below). In general, the support for aarch64 seems spotty (as opposed to microcontroller boards). As of Jan 2021, the support was described as "stalled". I would expect caveats.
That being said, it's gonna be fun to try! If you are interested, let us know by all means! We can provide JTAG hardware for you.
References:
https://metebalci.com/blog/bare-metal-raspberry-pi-3b-jtag/
https://www.suse.com/c/debugging-raspberry-pi-3-with-jtag/
https://www.linaro.org/blog/open-on-chip-debugger-ocd-at-linaro/
https://collaborate.linaro.org/display/TCWGPUB/OpenOCD+for+AArch64